Your first MeridianEase project starts with one thing: a clean, consistent view of how your business outcome and marketing activity changed over time. This guide walks through the complete first-run workflow—from signing in and downloading the template to uploading data, mapping columns, running the model, and reviewing the results.
Before you start: gather the right inputs
Set aside weekly historical data for at least 52 continuous weeks. Longer, consistent history can give the model more context, especially when your business has meaningful seasonality or promotional cycles.
Your dataset should include:
- Week: one date per weekly observation, formatted as
YYYY-MM-DD. - Primary KPI: the outcome you want to understand, such as conversions, orders, leads, revenue, or conversion value.
- Brand search: a measure of branded demand, such as aggregated branded-query impressions from Google Search Console or a Google Trends index.
- Paid media: weekly spend plus the channel activity fields requested by the template, such as clicks or impressions.
- Non-paid activity: optional organic or partner activity where it is relevant and available, such as Organic Search, Organic Social, or Influencers.
- Business controls: relevant factors outside media that may affect the KPI, such as promotions, pricing changes, holidays, or other known events.
Use the downloaded MeridianEase template as the source of truth for the exact column structure. If your source systems use different names, keep a simple data dictionary so you can explain how each source column maps to the template.
1. Sign in and create a project
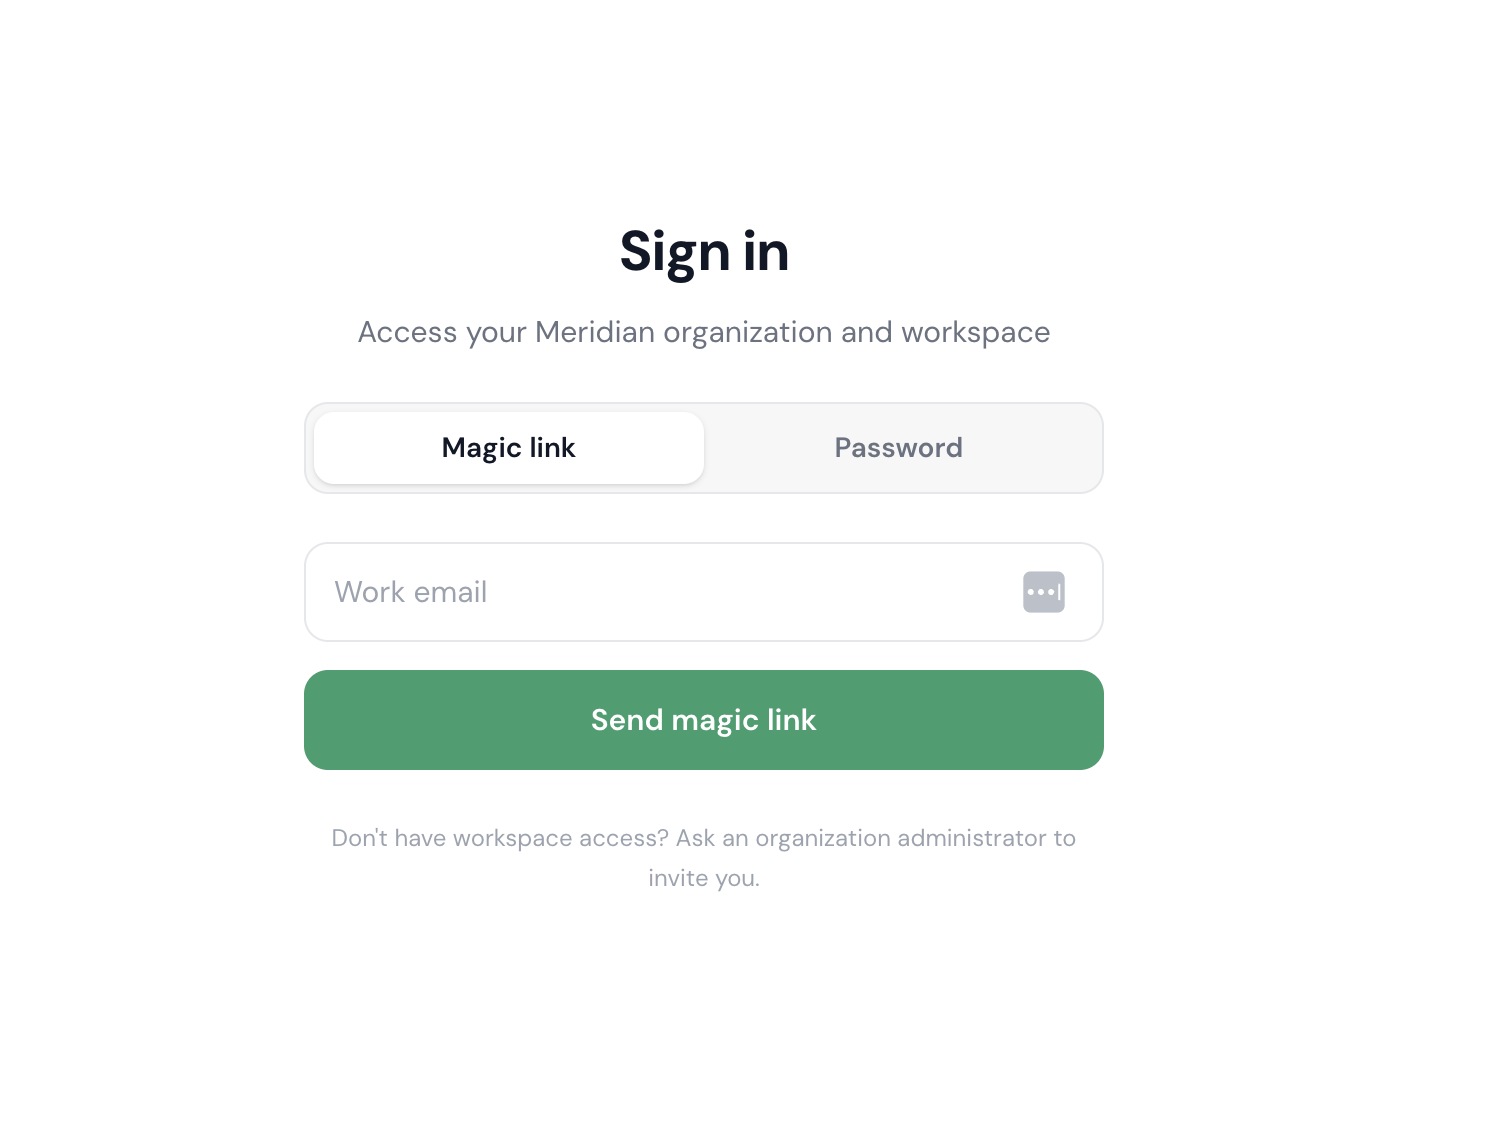
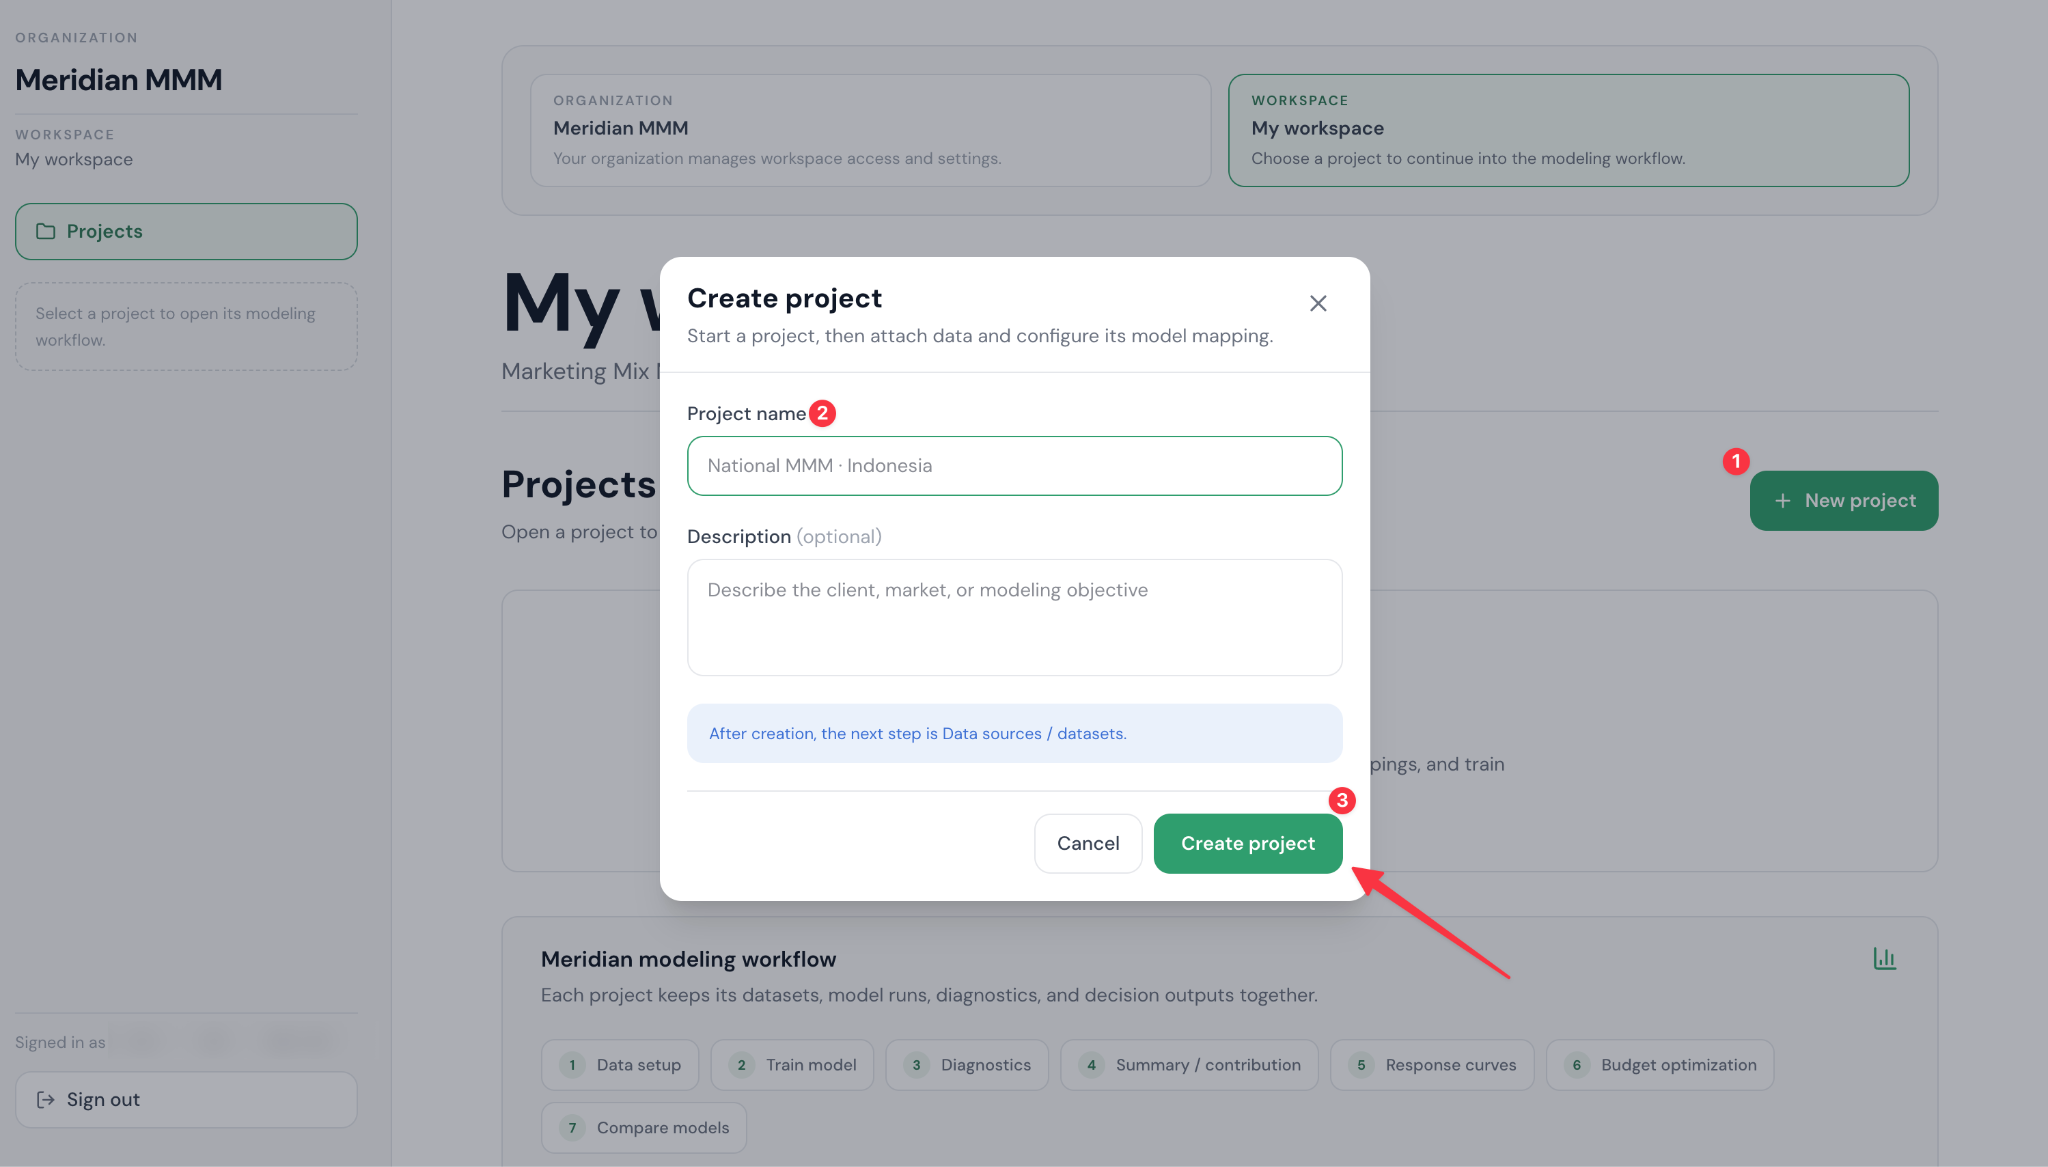
Open app.meridianease.com and sign in. Create a new project for the business, market, or analysis you want to measure. Give it a name that will still make sense when you return to it later—for example, “UK ecommerce — 2025 full-year model.”
Open the project and go to Data Setup. Keeping one clear project per analysis helps prevent mixing incompatible date ranges, markets, or KPI definitions.
2. Download the template and prepare your data
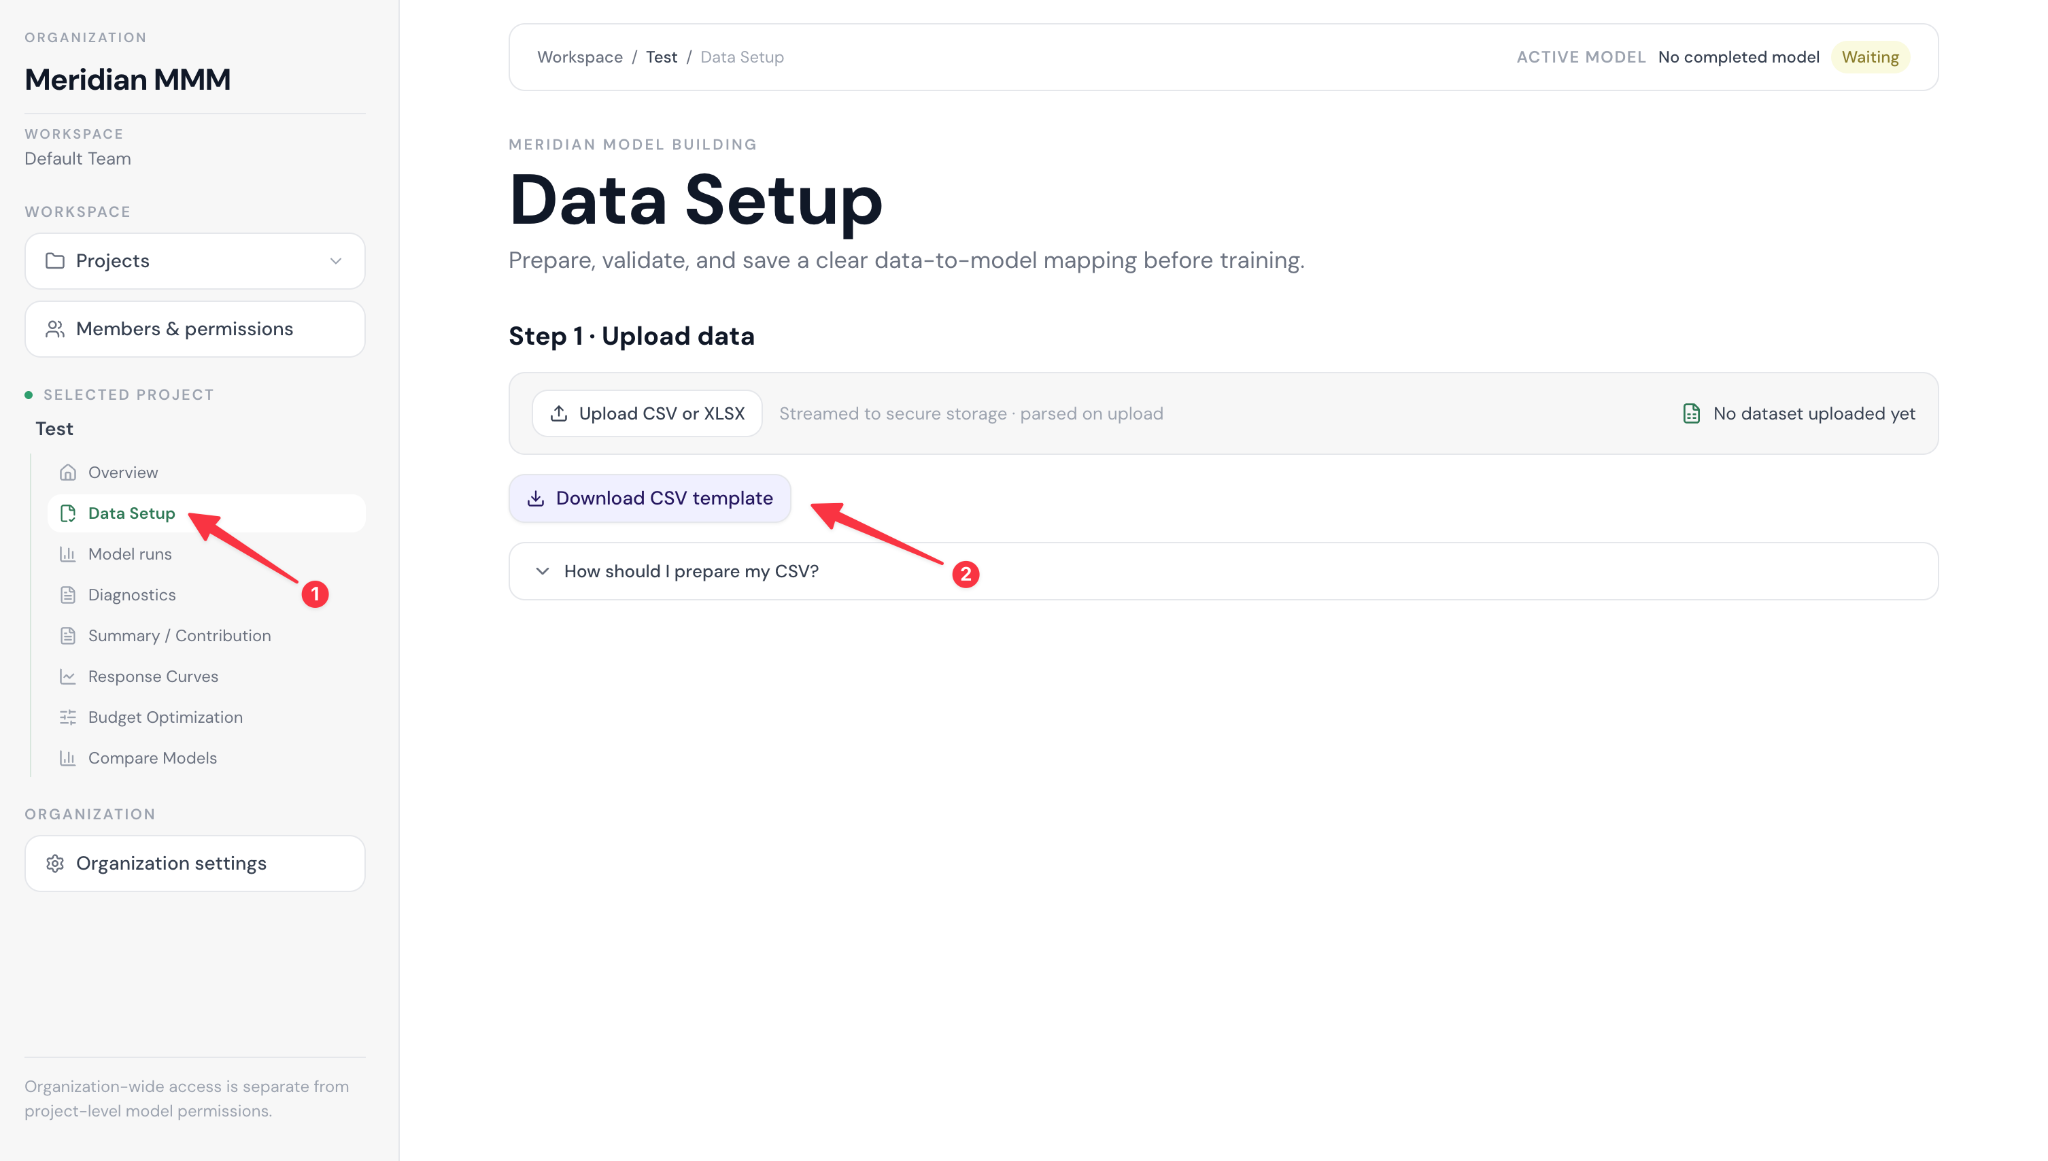
In Data Setup, download the CSV template. Add your weekly observations without changing the meaning of the fields. Before uploading, check the following:
- Weeks are continuous and consistently formatted.
- There is one row per week and no accidental duplicate weeks.
- Spend, clicks, impressions, conversions, and value use consistent units throughout the period.
- Missing values are reviewed rather than silently replaced with zero.
- Channel names are stable and consistently defined.
- The KPI column represents the decision you want the model to support.
Save the completed file as CSV or XLSX. If you combine exports from multiple platforms, do that before upload and document the transformation.
3. Upload the file and map the columns
Return to your project’s Data Setup area and upload the prepared CSV or XLSX file. Then complete the mapping flow:
- Choose the date or week field.
- Select the primary KPI and confirm whether it is a volume or value outcome.
- Map paid channels, including spend and the available activity measure such as clicks or impressions.
- Map brand search and any non-paid channels you want to include.
- Map relevant controls such as promotions, pricing, holidays, or other business events.
- Review the mapping carefully and select Save column mapping.
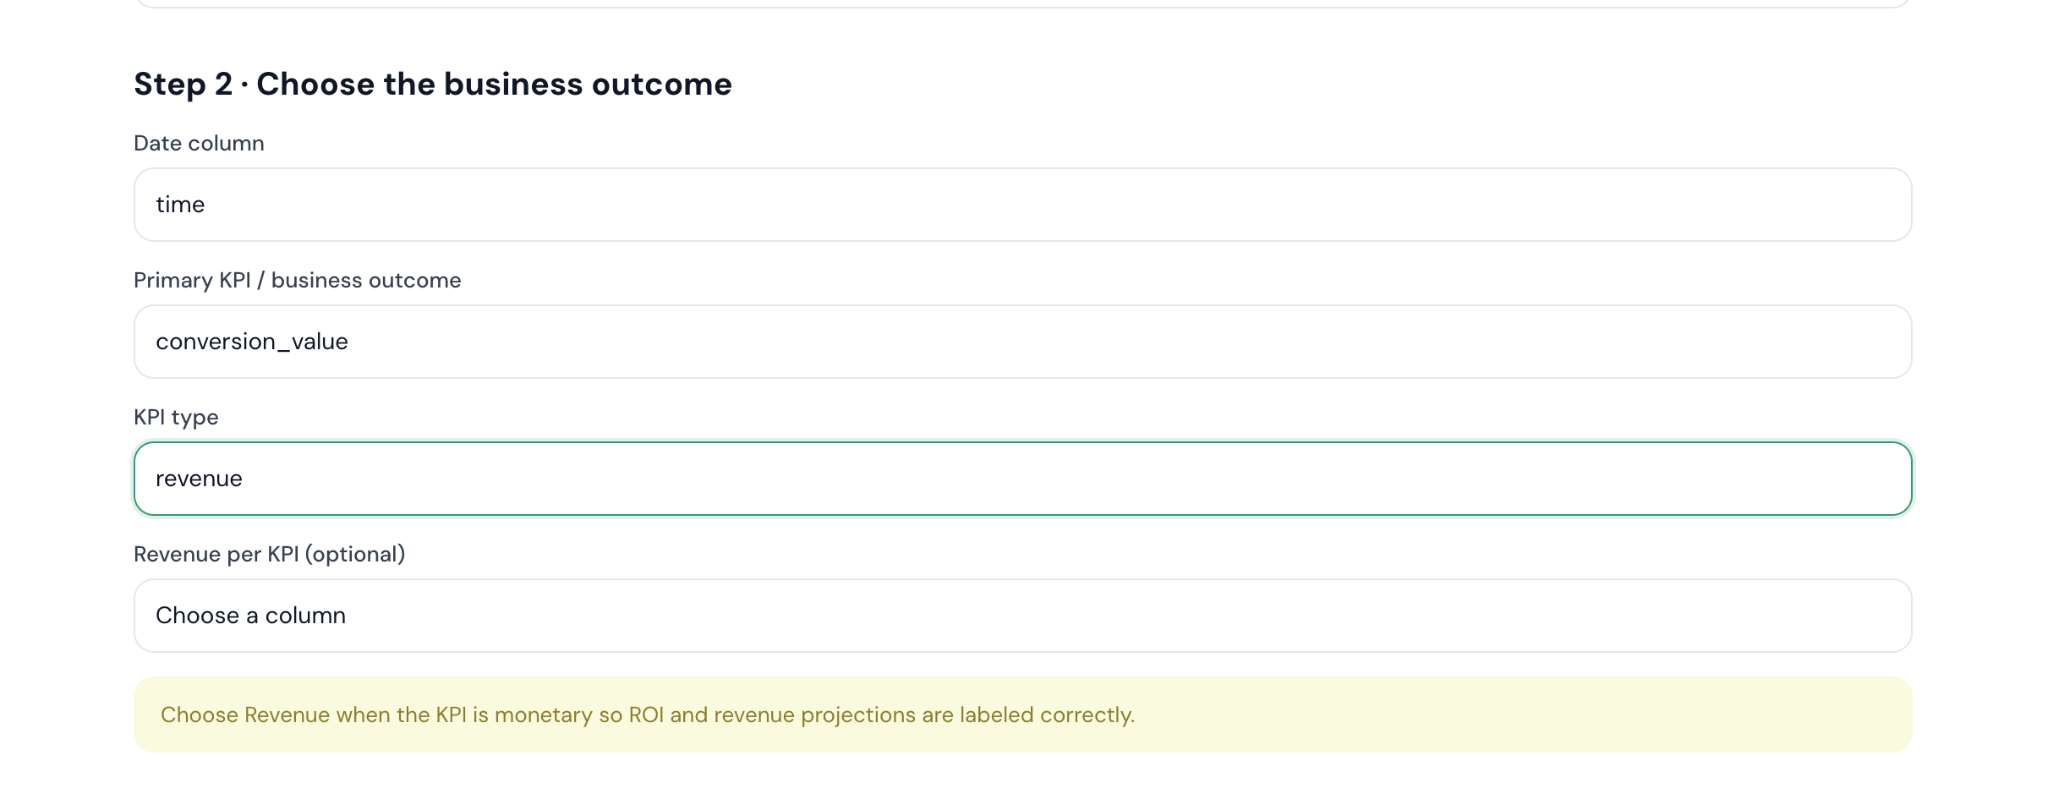
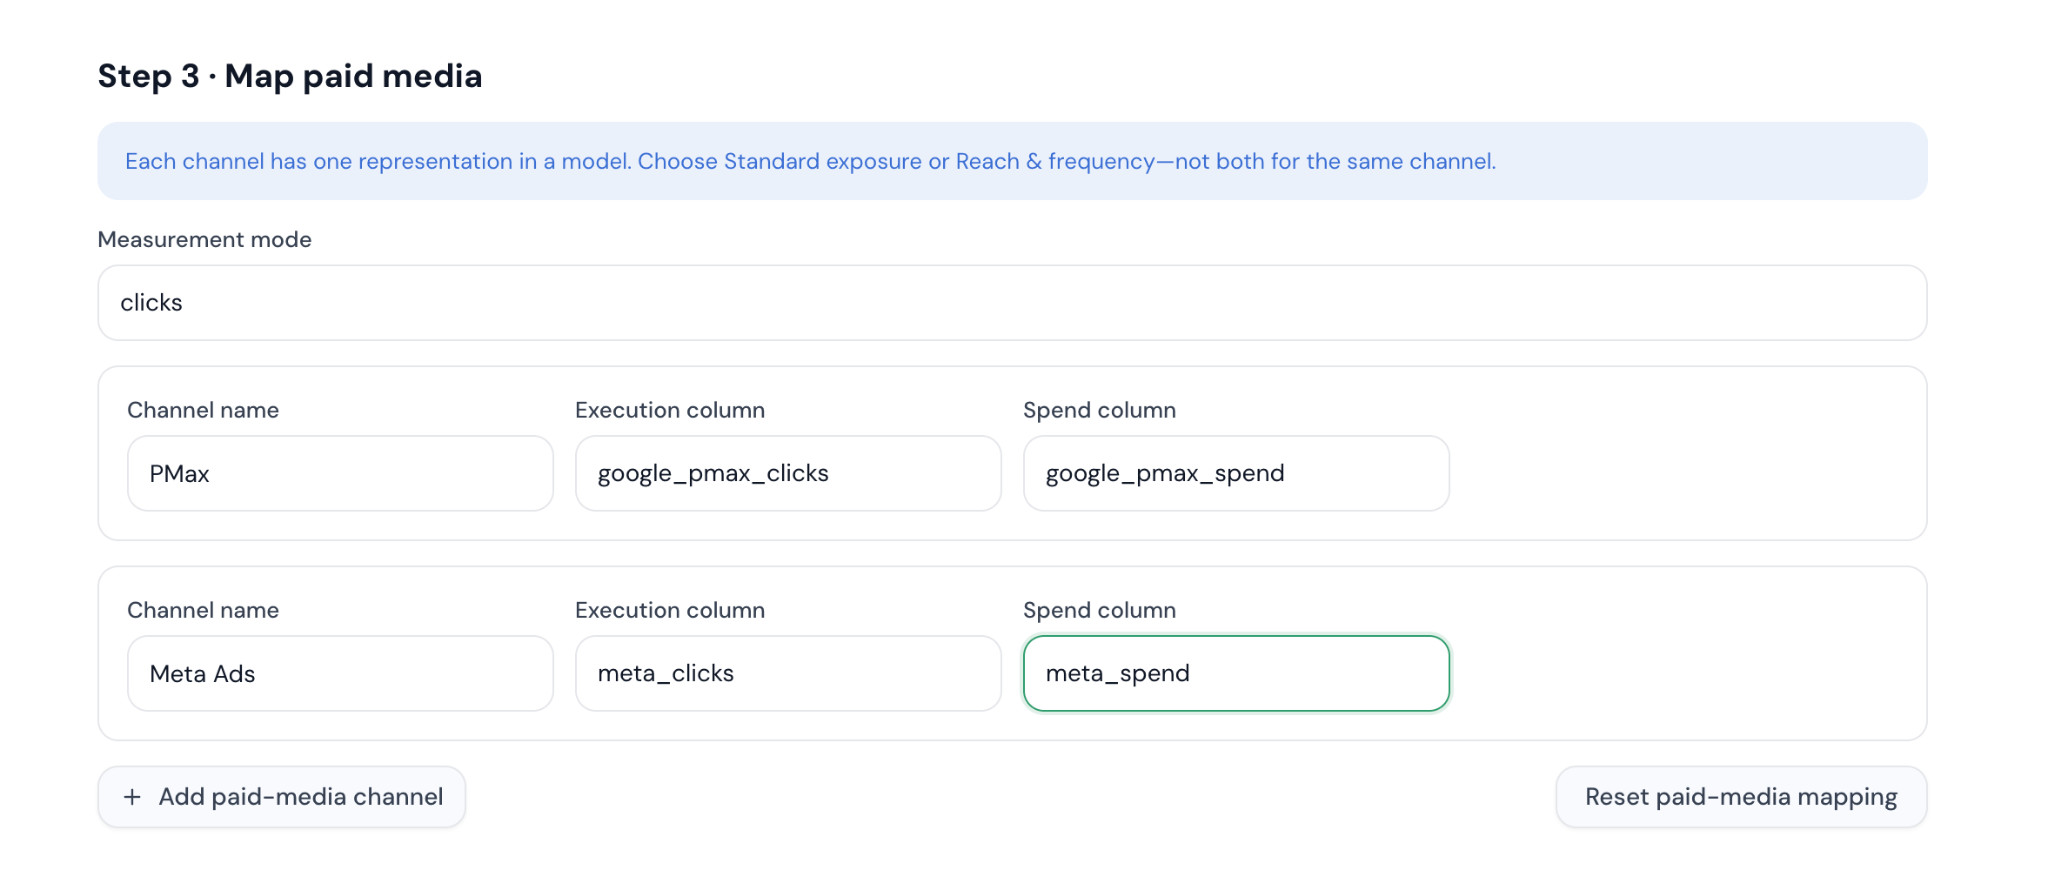
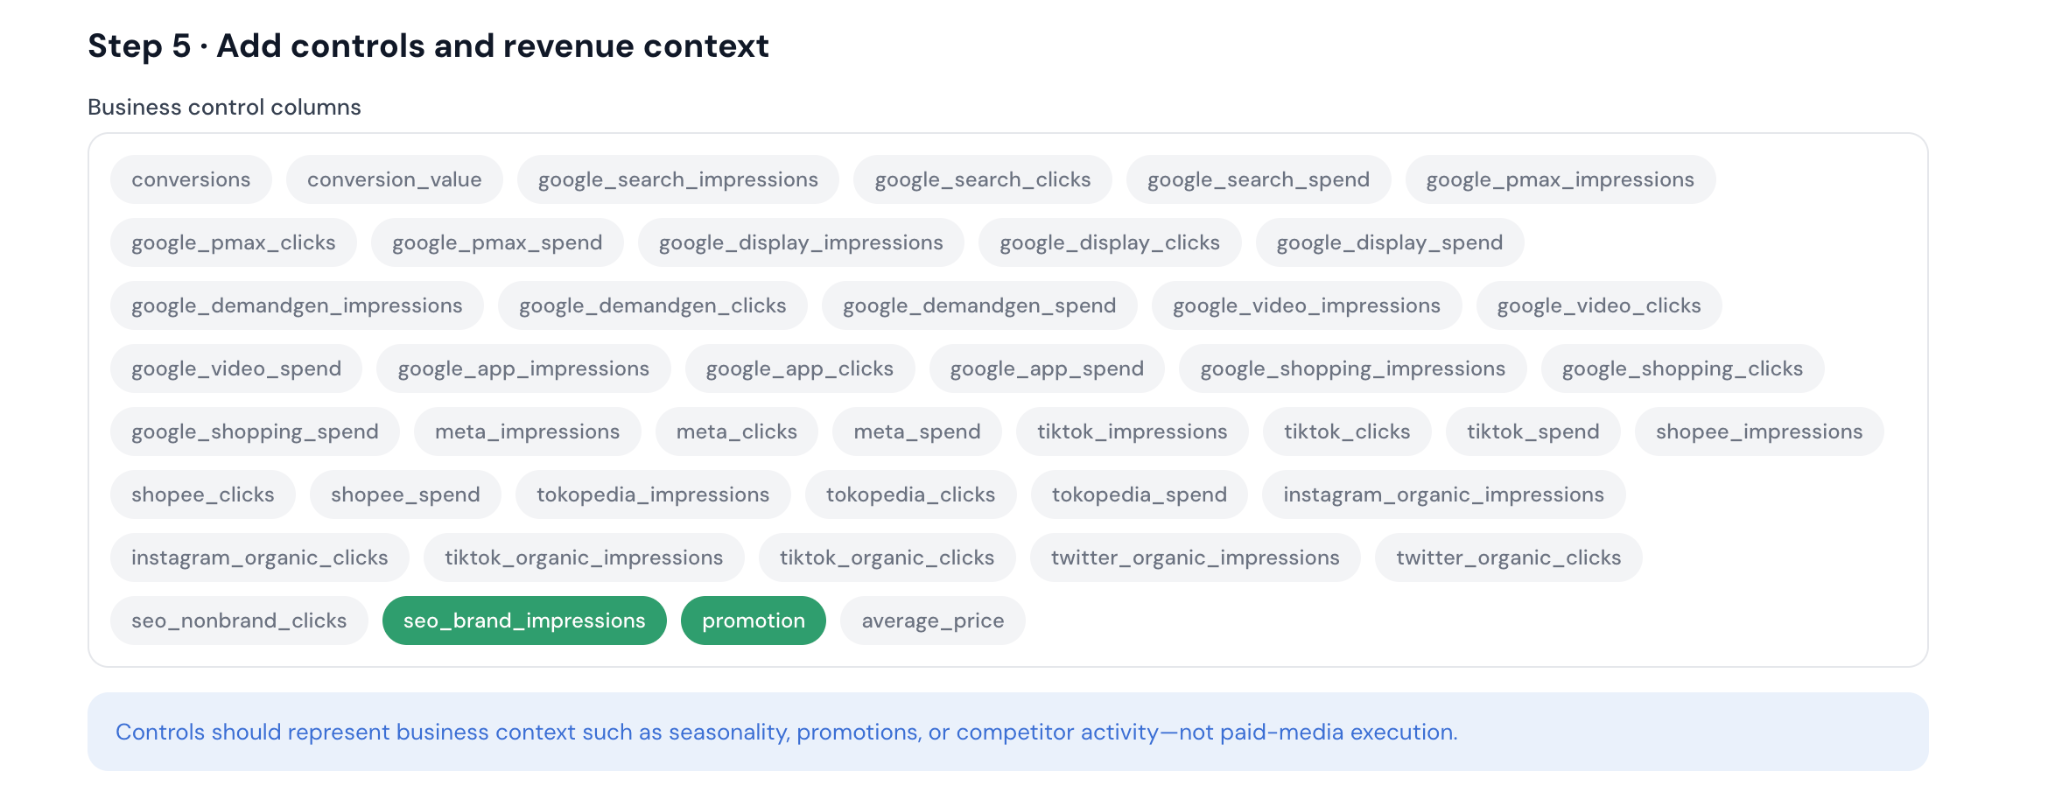
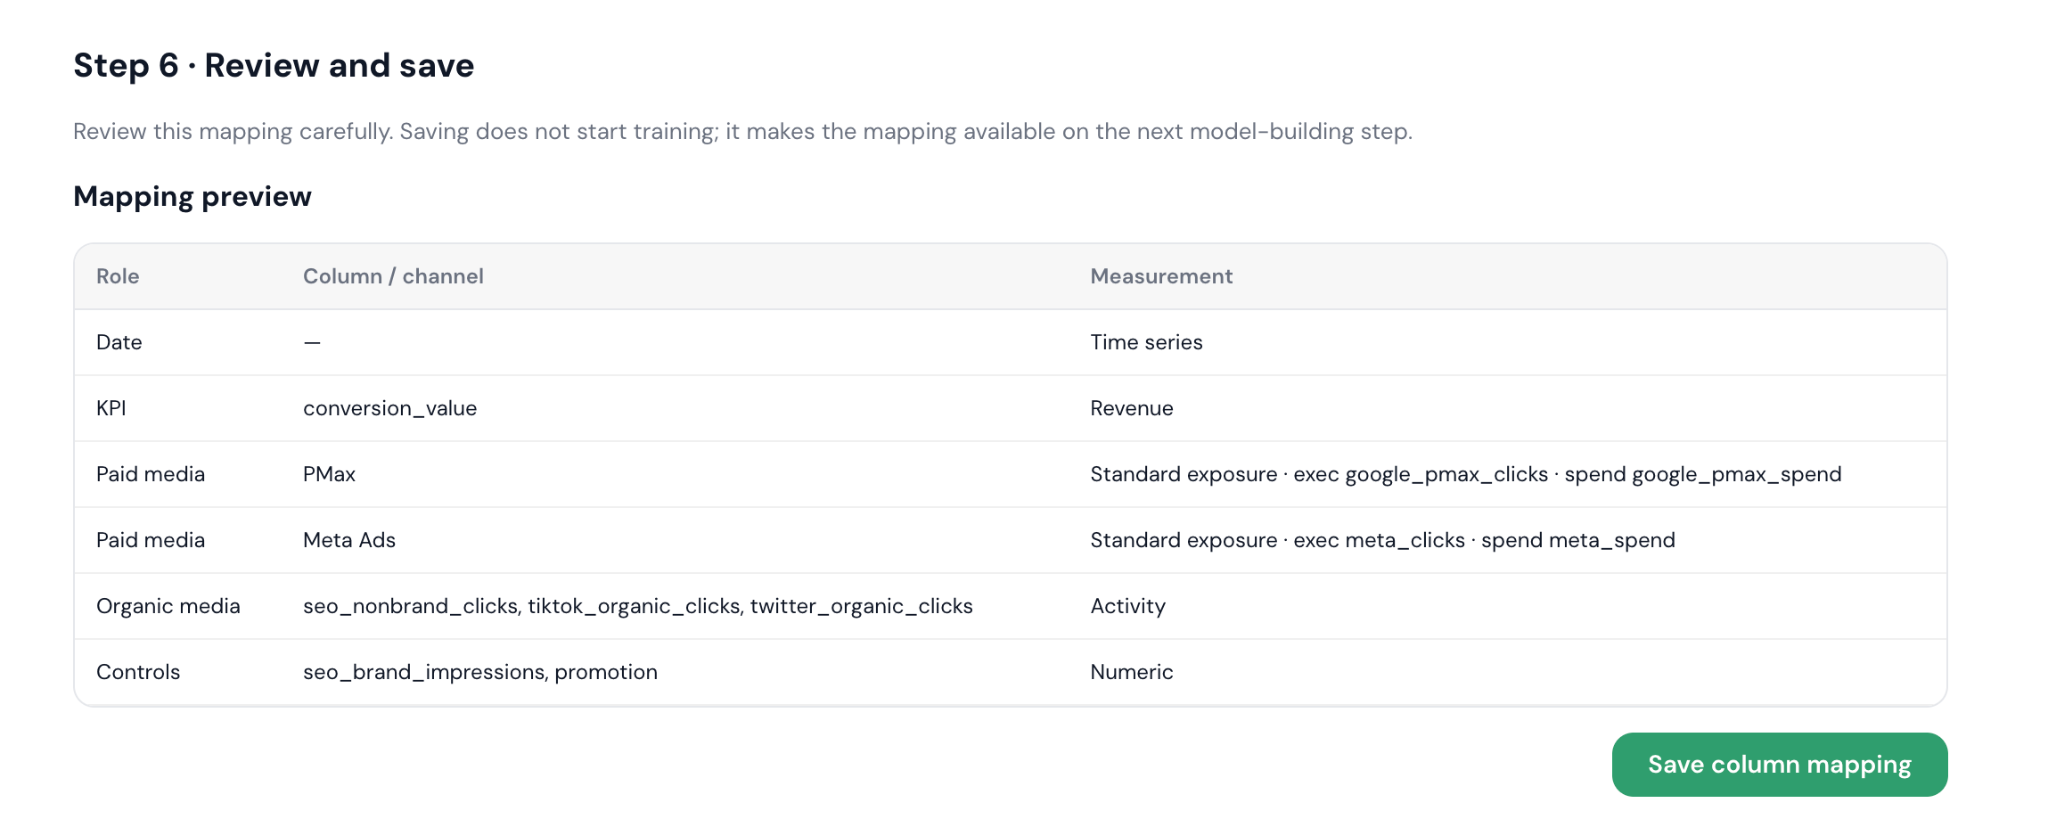
Do not map a column simply because it exists. Each mapped field should have a clear definition, consistent units, and a reason to be included. If you are unsure about a field, leave it out for the first run rather than guessing.
4. Run the full model
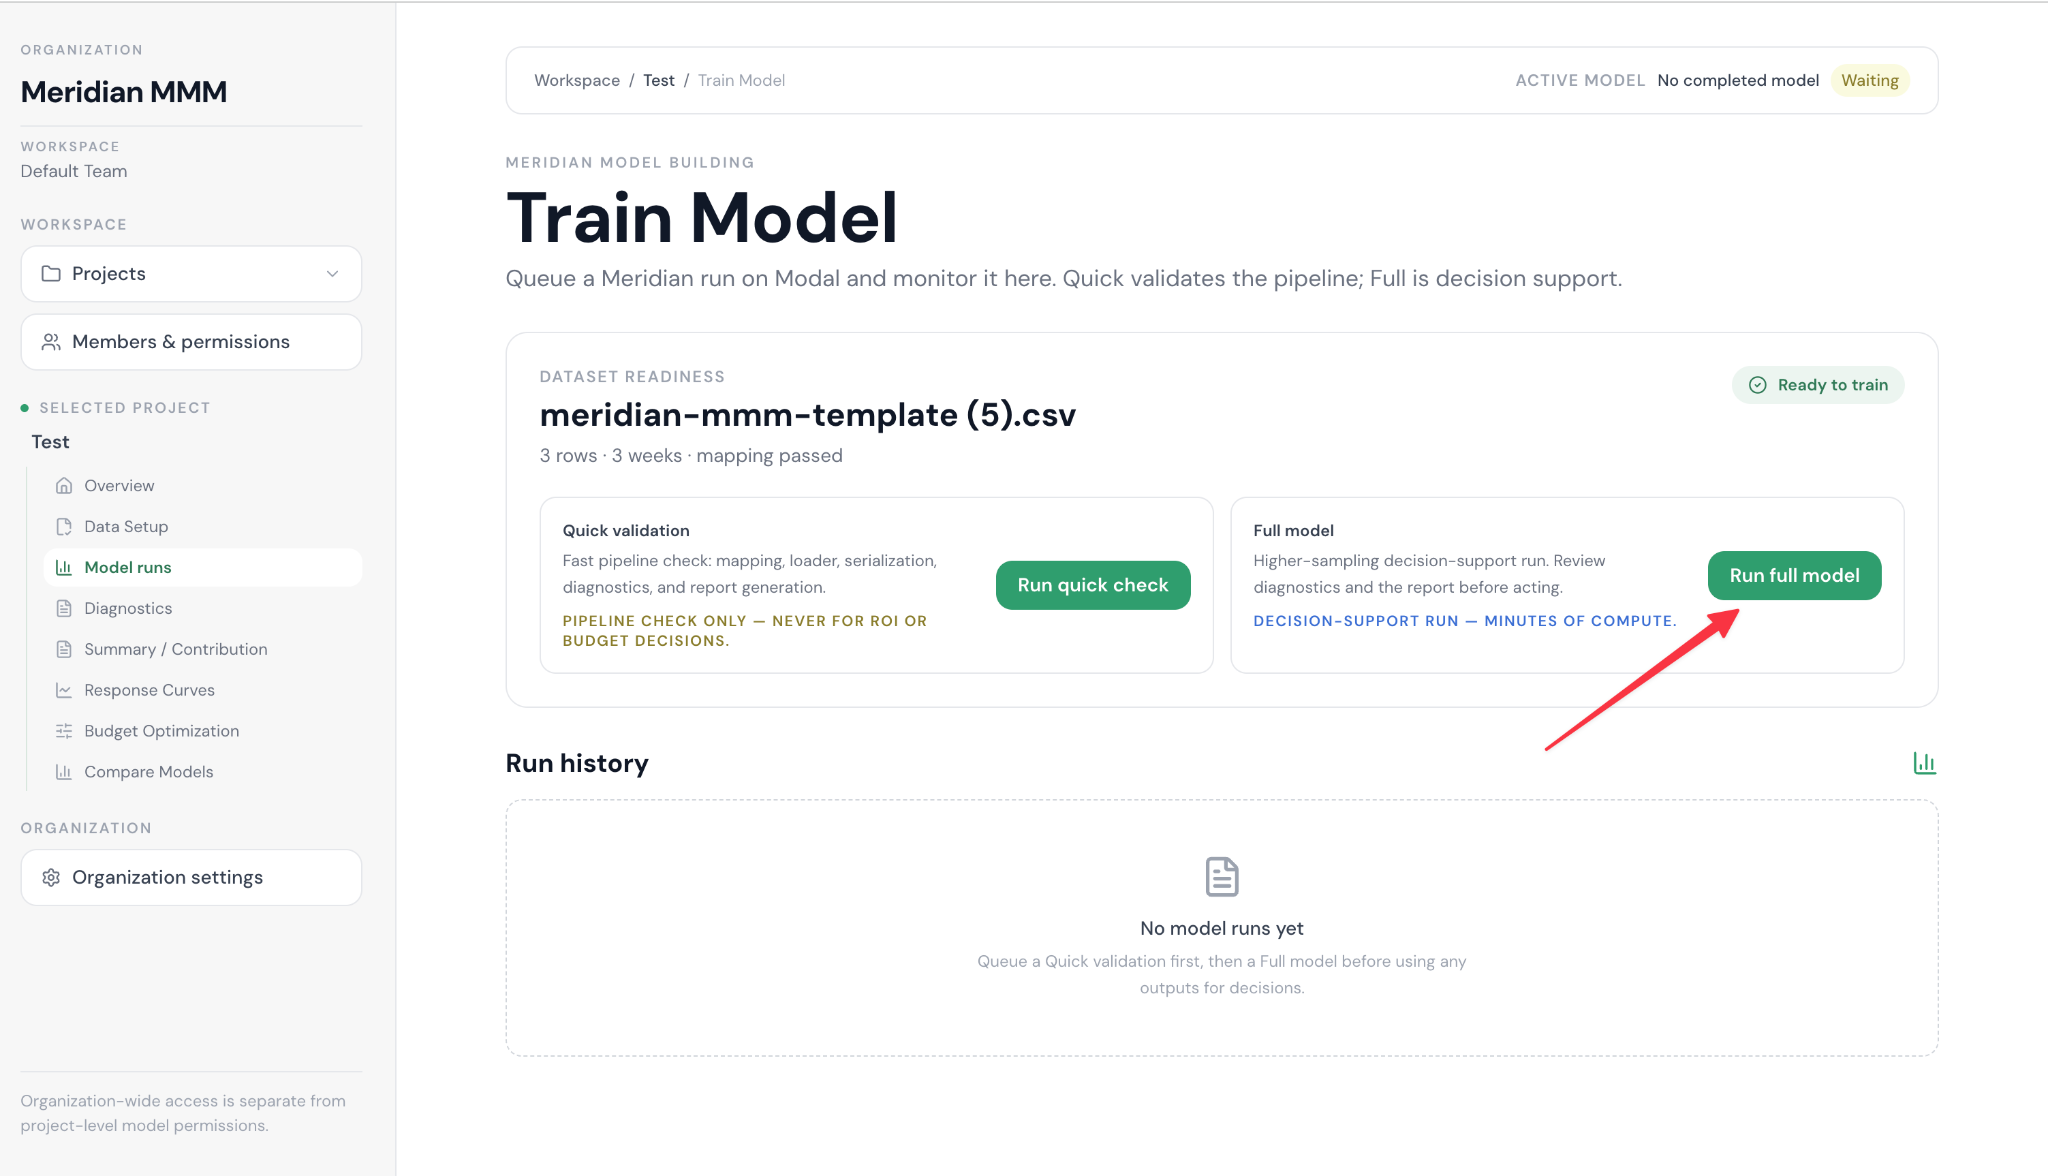
After the mapping is saved, open Model Runs and choose Run full model. A run commonly takes around 5–10 minutes, but timing can vary with the dataset and system activity. Wait for the run status to indicate that training has completed.
A successful run is the beginning of the review—not the end. The model output is an estimate based on the data and assumptions you supplied.
5. Review the results before making a decision
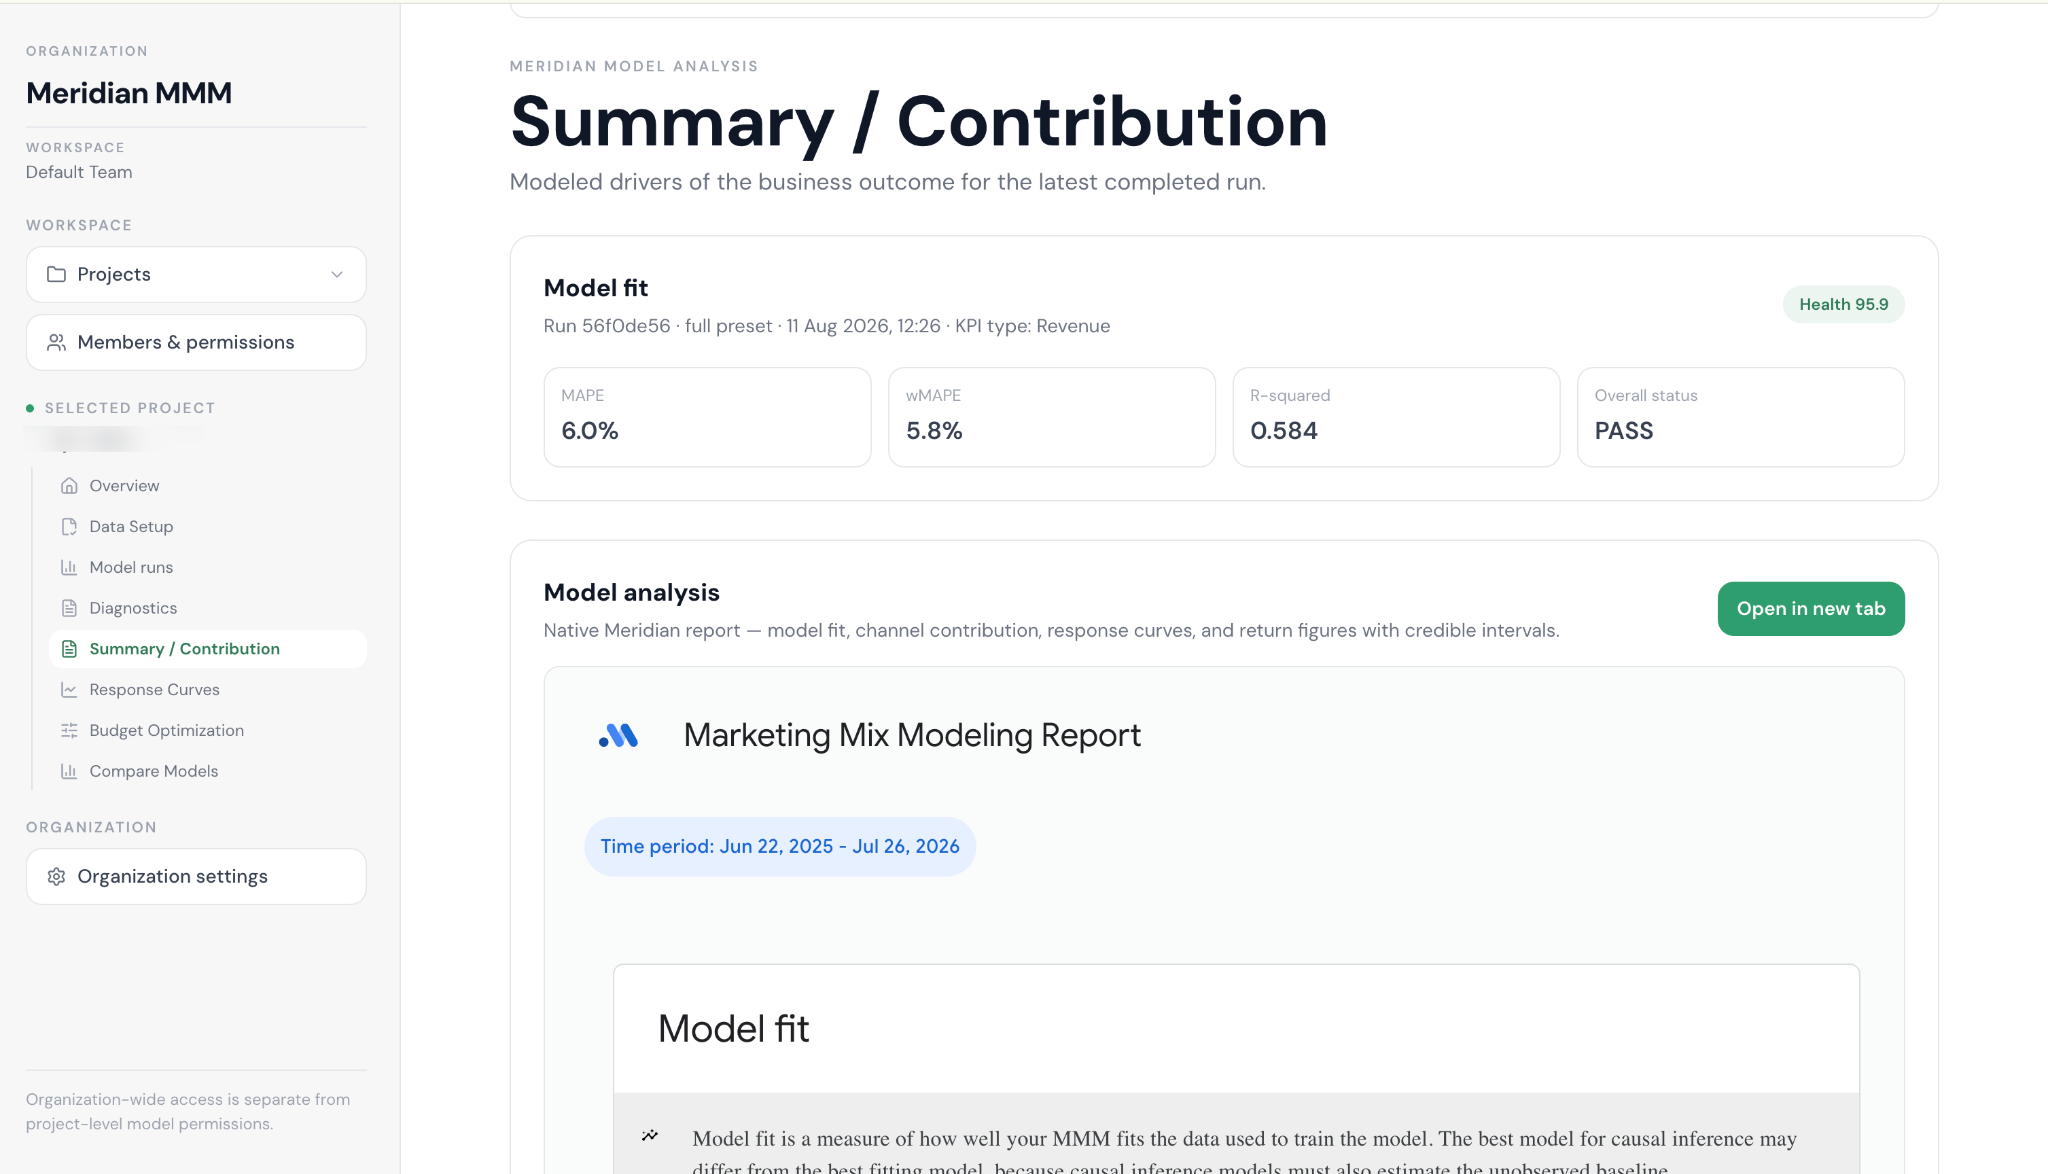
Once training is complete, open Summary / Contribution. Start with the big picture:
- Is the modeled KPI the outcome your team actually cares about?
- Do the channel contributions and performance metrics look directionally reasonable?
- Do the results reflect known promotions, seasonality, or major business changes?
- Are there channels or controls whose estimates need additional investigation?
- What would change if you adjusted the assumptions or added better data?
Use the output to frame a budget conversation, not to claim that one number is permanent truth. Compare the findings with experiments, business context, and other measurement methods where available.
The strongest first model is not the one with the most columns. It is the one your team can explain, challenge, validate, and improve.
If something does not work
Upload fails
Confirm that the file is CSV or XLSX, the date field uses a consistent format, and the file follows the downloaded template. Remove duplicate headers, unexpected blank rows, and unsupported extra sheets if your XLSX contains multiple tabs.
Mapping does not look right
Check that the source column names are unique and that each column has one clear meaning. Verify that spend, clicks, impressions, KPI, and brand search are not being swapped.
The model run fails or takes longer than expected
Check the run status and review the project data for missing weeks, extreme formatting problems, or columns with no variation. If the issue continues, save the project name, dataset period, and displayed error message before contacting support.
The results look surprising
Do not immediately delete the run. First check the KPI definition, channel mapping, controls, data coverage, promotions, and major events in the period.
Your next step
Start with one well-defined project and a dataset your team understands. After the first run, use what you learn to improve channel definitions, add relevant controls, and create a repeatable reporting cadence.